

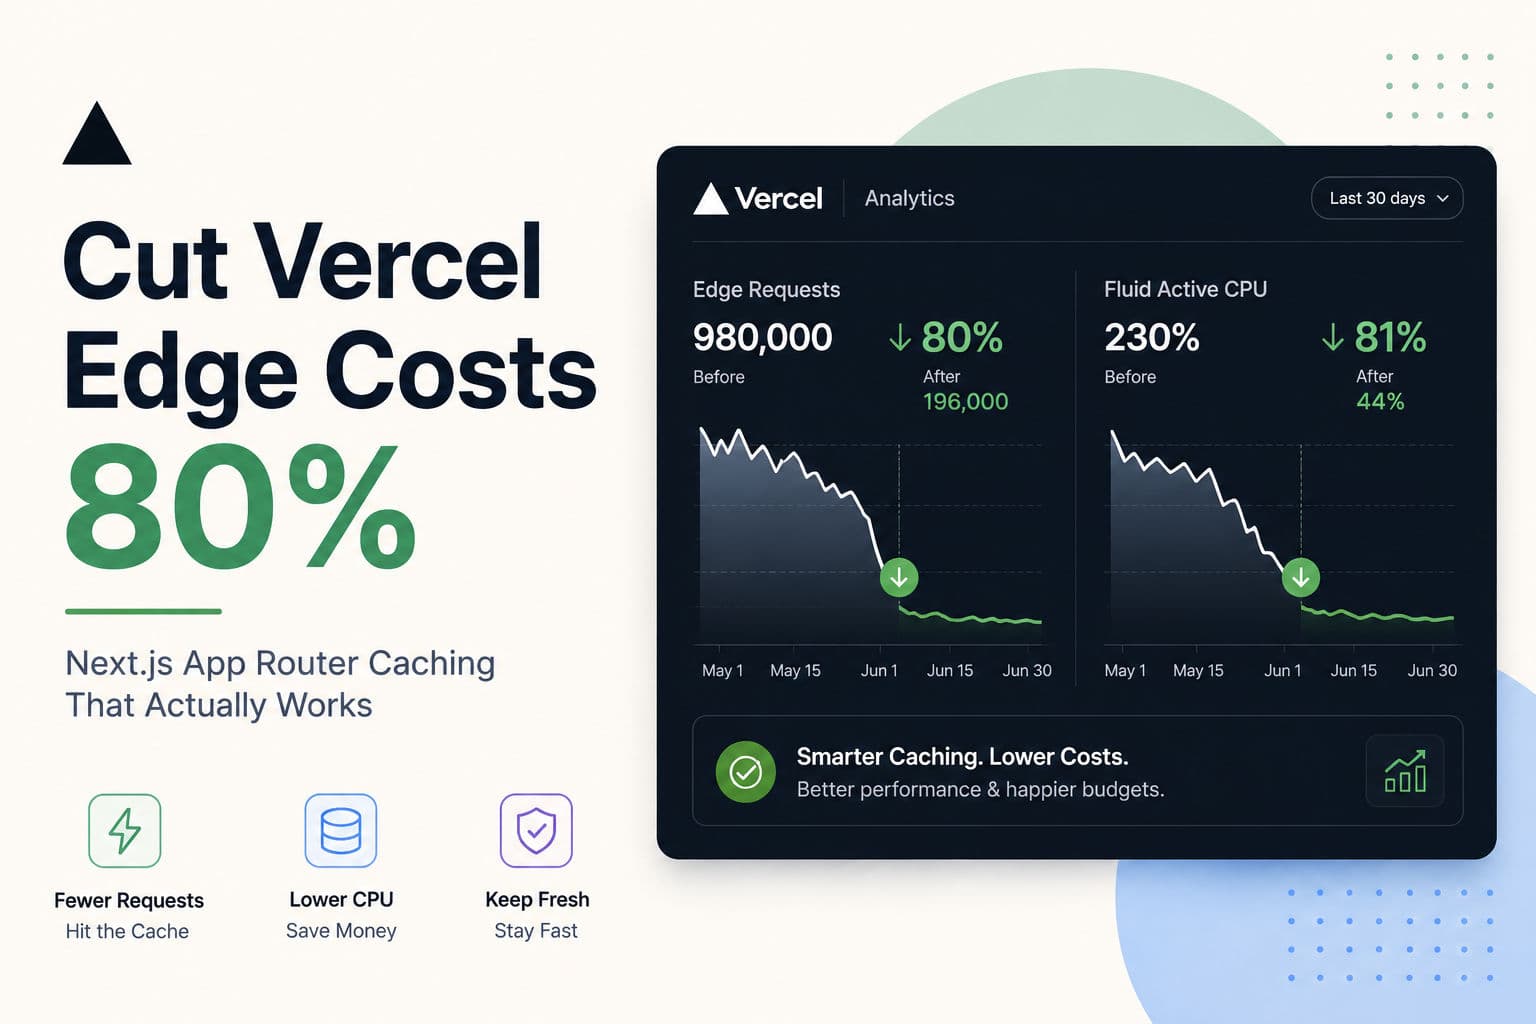
Vercel’s pricing sneaks up on you. You deploy a Next.js App Router site, everything feels fast, and then three months later you’re staring at a warning email: Fluid Active CPU at 230% of your plan’s limit and edge requests closing in on a million per month. I’ve seen this pattern on multiple client projects—and the fix is almost never “upgrade the plan.” It’s almost always a caching and rendering strategy problem.
Here’s exactly how I think through these situations.
1. Why App Router burns CPU by default
The App Router’s mental model is “everything is a Server Component.” That’s powerful—but it means that without explicit caching directives, every request can trigger a full server render. Unlike the Pages Router where getStaticProps made you opt in to server work, the App Router makes you opt out of it. Most teams don’t realize this until their Vercel dashboard starts blinking.
Fluid Compute (Vercel’s serverless runtime for App Router) bills by active CPU time, not just invocation count. A route that does a database fetch, renders a tree of Server Components, and returns HTML is burning CPU the whole time. Multiply that by 980,000 edge requests a month and you see how the math gets ugly fast.
The two levers that matter: reduce how many requests reach the server at all (caching and CDN hits), and reduce how much work the server does per request (static rendering and partial revalidation). Everything else is noise.
2. Audit before you touch anything
Before changing a single line of code, I pull up two things: Vercel’s Analytics tab and the Functions log. What I’m looking for:
- Which routes have the highest invocation counts?
- Which routes have the highest average duration?
- Are any routes marked
dynamic = ’force-dynamic’that shouldn’t be? - Is the
x-vercel-cacheresponse header showingMISSon every request?
That last one is the smoking gun. Open DevTools on any high-traffic route and check the response headers. If you see x-vercel-cache: MISS on every reload, you’re getting zero CDN benefit and paying for a server render every single time. On a content-heavy page with stable data, that’s pure waste.
The goal of the audit is a prioritized list: which routes, if made cacheable, would cut the most requests? Start there—don’t spread your effort across twenty routes when three routes are responsible for 70% of the load.
3. Go static-first, not dynamic-first
The fastest server request is the one that never happens. If a route’s data doesn’t change per user and doesn’t change every second, it should be statically generated—or at minimum, ISR’d with a sensible revalidation window.
In App Router terms, this means:
- Don’t call
cookies(),headers(), orsearchParamsin a Server Component unless you genuinely need them—each one opts the entire route into dynamic rendering. - Use
export const revalidate = 3600at the route segment level for content that’s fresh enough at one-hour intervals. - Use
generateStaticParamsfor high-traffic parameterized routes (product pages, blog posts, comparison pages). Pre-building the 500 most popular slugs can turn 500 dynamic renders into CDN cache hits.
A comparison tool like the one in the source article—credit card reward rates, lounge perks, forex fees—is a textbook case for this. The data changes maybe once a week. Serving it dynamically on every request is trading money for no perceptible freshness benefit to the user.
4. Cache headers and revalidation that actually work
Next.js 15 changed the caching defaults. fetch calls are no longer cached by default—you have to opt in explicitly. If you upgraded from Next 13/14 without auditing your fetch calls, you may have silently lost caching that used to be automatic.
      // app/compare/[slug]/page.tsx

      // Opt this fetch into the data cache with a 1-hour revalidation
      const data = await fetch(`https://api.example.com/cards/${slug}`, {
        next: { revalidate: 3600 },
      });

      // Route-level ISR: regenerate at most once per hour
      export const revalidate = 3600;

      // Pre-build the top 200 slugs at deploy time
      export async function generateStaticParams() {
        const slugs = await getTopCardSlugs(200);
        return slugs.map((slug) => ({ slug }));
      }
The next.revalidate option tells the data cache how long to consider this response fresh. Combined with a route-levelrevalidate export, you get ISR: the page is served from cache, and regenerated in the background when stale. Users never wait for a cold render.
For routes where data freshness is important but not second-by-second, I set revalidation at 5–15 minutes. That alone can turn a route that was burning CPU on every request into one that regenerates maybe 100 times a day regardless of traffic volume. The math on Vercel’s CPU billing changes dramatically.
5. Edge runtime vs. Node.js runtime—pick carefully
Edge runtime is tempting because it sounds fast. But there’s a trap: edge functions have tight CPU and memory limits, and if your route is doing anything non-trivial—database queries, ORM calls, heavy JSON processing—you’ll hit those limits and either get errors or pay for retries.
The pattern I’ve settled on: edge runtime for lightweight middleware (auth token validation, geo-routing, A/B splitting) and Node.js runtime for anything that touches a database or does real computation. The edge is a traffic cop, not a compute workhorse.
If you’re using export const runtime = ’edge’ on a route that runs Prisma queries or processes arrays of data, that’s likely a contributor to your CPU overrun. Move it back to the Node.js runtime, add proper caching, and you’ll often see both cost and latency improve.
6. What I’d actually do on a client project
When a client comes to me with a Vercel bill that’s gone off the rails, here’s the honest order of operations I follow:
- Freeze spending first. If you’re at 230% of your CPU limit, the priority is stopping the bleeding before optimizing. Set Vercel spend limits if you’re on a plan that supports them. Consider temporarily adding aggressive cache headers site-wide even if it means slightly stale data—stale data is better than a surprise $800 invoice.
- Find the two or three hot routes. In my experience, 80% of Vercel costs on App Router sites come from 2–4 routes. The homepage, the main listing/comparison page, and maybe one API route. Fix those first.
- Check for accidental dynamic opt-ins. Search the codebase for
cookies(),headers(),noStore(), andforce-dynamic. Every one of those is intentionally or accidentally opting a route into full dynamic rendering. Half the time I find them in utility functions that get imported widely without the dev realizing the rendering implication. - Add ISR to content routes. Static data that’s being rendered dynamically is the single highest-ROI fix. A one-line
export const revalidate = 300can drop a route from 50,000 CPU-burning renders a day to 288. - Don’t over-engineer it. I’ve seen teams reach for Redis caching layers, custom CDN configurations, and edge middleware rewrites before they’ve even verified their routes are using ISR. The App Router gives you most of what you need built-in. Use it before adding infrastructure complexity.
The 80% cost reduction number in the headline of the source article is real and achievable—but only if you’re starting from a position where caching was basically absent. If your site is already doing ISR correctly, the gains from further optimization are much smaller. Know where you’re starting from.
If you’re shipping a Next.js app and the Vercel dashboard is becoming stressful, a development consultation can help you triage fast. I’ve done this across enough projects to know which fixes actually move the needle and which ones waste a sprint. You can also browse the case studies to see how I’ve approached performance and cost problems on real production apps.